
What Would Your Team Do Differently If You Saw Customer Sentiment Shift Every Monday?
Product standups and sprint planning already cluster early in the week. Shifting the signal window to match that rhythm removes the lag between seeing a problem and assigning a ticket. Most teams face a structural gap where survey data and product data live in separate tools and never meet.
A customer signal dashboard provides a lightweight weekly view combining stated feedback from surveys and observed behaviour from product usage. The weekly cadence targets a 7-day lookback closed each Friday at 17:00 local time so the Monday review uses a complete week. You can build this working view within two to three working days using exports already available to most product teams.
Step 1: Choose the Signals Worth Tracking Weekly
Signal selection dictates the dashboard's utility. You need two signal families: stated metrics like NPS, CSAT, and open-text themes, alongside observed metrics such as active usage, feature adoption, and drop-off points.
Pick four to six signals maximum that map to a decision someone actually makes weekly. Walk backward from roadmap tweaks, outreach triggers, or onboarding fixes. Discard any candidate signal that lacks a named owner.
Signal Selection Filter Where weekly survey sampling yields roughly 25 to 40 responses in the period, the point estimate becomes directional rather than noise. When volume falls below that band, rotate one question per week or widen the collection window to 10 to 14 days instead of forcing a thin weekly read.
Survey export fields used as the stated-signal source must include the score, free-text theme tags, and any comparative benchmarking cohort labels already present in the file.
Step 2: Structure Your Segments Before You Build Anything
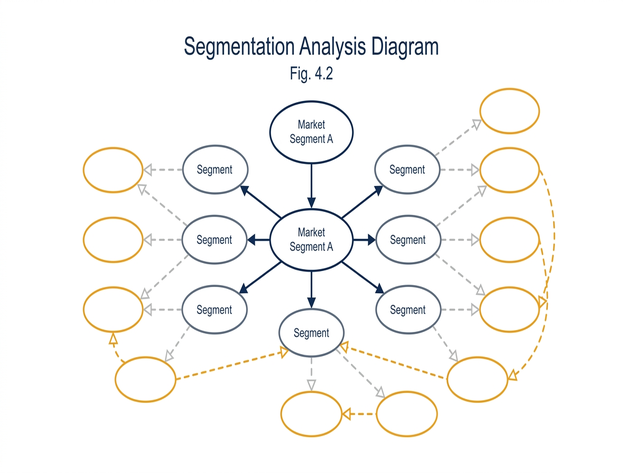
Where early internal trials masked opposing movements, the finding follows that an aggregate number hides the true story. Aggregate CSAT without tenure splits can show a flat week while new users decline and established users rise by a similar magnitude, cancelling each other out in the total.
Define your core segment axes before connecting the data. Most product teams rely on plan tier, tenure, and activation status. Keep three to four segment definitions fixed for at least 8 to 12 consecutive weeks before revising labels.
A reliable mini-example splits new users at 0 to 30 days tenure versus established users past 30 days. This simple division frequently surfaces opposite CSAT directions in the same calendar week.
Data Join Pitfall
Segment definitions must be identical in both the survey export and the product analytics export. Mismatched tenure cutoffs or plan-tier labels break the join without raising an error.
Step 3: Join Survey and Product Data on a Common Key
You need a shared identifier to link a survey response to that user's behaviour. Check which identifier already appears in both exports—user ID, account ID, or hashed email, rather than inventing a new mapping table.
Where individual-level linkage proves impossible due to anonymous responses, fall back to segment-level joins, a standard concession in cross-cultural data methodologies when privacy regulations restrict direct tracking. The pipeline shape requires the survey export file and the product analytics export file to land in one weekly table keyed by segment and ISO week number.
Schedule the table refresh window between Friday 17:00 and Monday 09:00 so the standup always reads a frozen snapshot. Access to the joined weekly table remains limited to the review group. Drop raw identifier columns after the join step when only segment aggregates are required.
Step 4: Track Change, Not Just Levels

Early dashboard iterations often display static level scores, but unchanged score cards quickly stop drawing comments in review meetings. The solution requires adding a week-over-week delta and a direction marker to every row.
Add a rolling baseline using the prior four complete weeks so a single noisy week avoids triggering false alarms. A move gets flagged only when the latest week sits outside that baseline band and the paired stated and observed signals move in the same direction.
A conversation threshold is met when a CSAT drop exceeds the four-week baseline spread alongside a same-week decline in a core feature’s active use. Check category baseline comparisons, where comparative benchmarking fields are available, before treating a dip as product-specific.
Step 5: Turn a Weekly Pattern Into a Product Decision

The dashboard proves useful only at the point it changes a decision. Build a short weekly ritual around it. Force each flagged row through a three-way classify step: investigate, act, or monitor.
Consider a worked path where falling activation-stage CSAT pairs with rising early drop-off. This generates a hypothesis about onboarding friction, leading directly to a scoped experiment. Log the correlation between an open-text theme and a usage drop as a lead, holding it for one to two further weeks of confirmation before making a shipping decision.
Monday Signal Review Runbook
- Confirm Friday exports landed and the weekly table refreshed before 09:00.
- Scan week-over-week deltas against the rolling 4-week baseline; mark rows outside the band.
- For each flagged row, pair the stated signal with the observed product behaviour.
- Classify the paired movement as investigate, act, or monitor.
Who Runs the Weekly Review
Assign ownership to a two-person core. A product analyst or UX researcher pairs effectively with a product manager. Larger committees slow the Monday ritual without improving signal quality.
Keep the core review group size at two to three people. Optional observers join only when a flagged signal touches their specific squad. These recommendations reflect applied weekly cadences used with Australian product and research teams, emphasizing lightweight ownership over heavyweight tooling.
Start With Three Signals This Week
Ignore warehouse perfection and start with three signals in a spreadsheet. The habit of looking weekly matters more than dashboard polish. Create a three-column sheet today, paste last week’s exports, and block a 20-minute Monday slot before the next sprint planning.
Use CSAT as the survey signal, weekly active use of one core feature as the product signal, and new-versus-established as the single segment split. Upgrade the tooling once the ritual sticks.