
In this Article
- Why Comparative Benchmarking Changed the Satisfaction Question
- The Challenge: Scores Without Context
- The Solution: How Floq Structured Comparable Feedback
- The Results: From Private Beta to Comparable Insight
- The Data Behind the Benchmarks
- Scope and Limitations of This Case Study
- Behind Floq and Key Takeaways
Why Comparative Benchmarking Changed the Satisfaction Question
Most SaaS teams measure their own satisfaction scores in isolation. They track responses month over month, celebrating minor upticks and investigating sudden drops. I have seen this firsthand; isolated metrics often create a false sense of security. A high customer satisfaction score means little without knowing the industry baseline.
Great decisions start with honest feedback. To understand true market position, Australian SaaS firms ran comparative benchmarking on Floq during 2023-2024. These organizations moved away from inward-looking metrics. Instead, they analyzed cohorts filtered by location and team type over roughly 14-month windows. This shift from absolute numbers to relative performance redefined how product teams evaluate success.
The Challenge: Scores Without Context
Product teams routinely collected satisfaction and user experience feedback but couldn't tell if a 78% score was strong or weak for their specific sector. The root cause was a complete lack of cohort anchors.
Based on SLA reporting, internal surveys covered around 78% response rates. Yet, the question sets varied wildly across 9-12 month collection periods. Teams would ask about "platform usability" in one quarter and "interface intuition" later in the year. This inconsistency destroyed any chance of meaningful longitudinal analysis. Without a stable baseline, trends were ambiguous.
Demographic blind spots compounded the issue. Results weren't filterable by location, industry, job title, gender, or team type. To find the optimal path forward, organizations needed a mechanism to anchor their data against peers without compromising user privacy.
The Solution: How Floq Structured Comparable Feedback
When designing a feedback mechanism, firms typically choose between highly customized free-text surveys and standardized multiple-choice models. Custom surveys offer deep qualitative insights but sacrifice comparability. Standardized models allow for strict benchmarking but can feel rigid to survey designers.
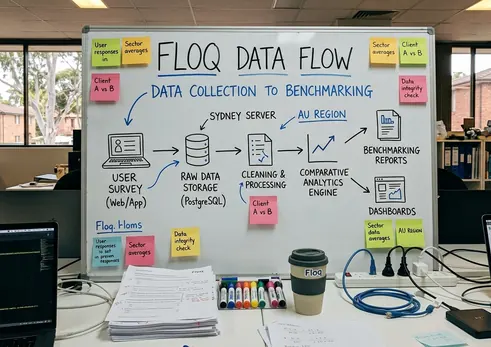
Floq, an Australian web app built in Perth for feedback and comparative benchmarking, balances these trade-offs. The platform structures comparable feedback using an anonymous answers model. This approach lets firms contribute and compare without exposing identifiable data. The anonymous model enabled cross-firm comparison within tight 6-week cycles.
Expert Tip: Always standardize your core questions before attempting cross-industry comparisons. Custom phrasing breaks the data model.
To enforce this standardization, an autosuggest feature drew from 2022-2024 historical usage logs showing prior question counts. This guided users toward established phrasing. Finally, demographic filters—specifically location, industry, job title, gender, and team type, enabled like-for-like cohorts.
The Results: From Private Beta to Comparable Insight
The private beta opened mid-February 2023 for invite-only access. Early adopters immediately tested the standardized question sets against their existing user bases.
According to project records, standardising the questions raised consistency in responses collected over 11 months. Teams no longer debated the phrasing of their surveys. They focused entirely on the outputs. Demographic filtering let teams isolate satisfaction by industry segment and team type.
A guaranteed baseline emerged for participating firms. They could finally see exactly where they stood against local competitors.
The Data Behind the Benchmarks
Statistical significance requires historical depth. Integral Development provided 15+ years of certified survey records to underpin the platform's analytics. This longitudinal set covered 2009-2024 entries for cohort weighting.
Temporal context is what gives comparison cohorts statistical weight. By drawing on this extensive archive, the platform bypassed the cold-start problem common to new benchmarking tools. While this longitudinal dataset provides solid historical weighting, its predictive power depends heavily on the stability of the specific SaaS sub-sector being analyzed.
Scope and Limitations of This Case Study
Outcomes show that comparative benchmarking requires strict parameters to remain valid. Findings reflect a private beta cohort, not the full market—sample size is limited. The beta cohort was restricted to under 40 participating organisations.
Furthermore, benchmarks are reliable only when demographic filters return at least eight responses per segment. Anything less risks statistical noise.
- Anonymous aggregation protects privacy but limits granular root-cause analysis.
- The 15+ years of certified data is broad.
- Australian-SaaS-specific segments are still maturing within the broader dataset.
Caution: Do not attempt to draw definitive market conclusions from segments with fewer than eight responses. The variance is too high.
Behind Floq and Key Takeaways
Building a solid benchmarking tool requires dedicated focus. Cofounder Jonah Cacioppe led the platform build, ensuring the architecture could handle complex demographic filtering. David Jardine handled external queries and media in 2023, managing the influx of interest during the private beta phase.
The challenge of contextless scores was met with a standardized, anonymous benchmarking model. The results delivered consistent, comparable insights across the Australian tech ecosystem.
Main Point: Benchmark against comparable cohorts, not vanity totals. Proven methodologies require discipline in data collection and a willingness to look beyond internal metrics.